|
|
Eutelsat W3A satellite spectrum analyser plots
Spectrum analyser plots of the Ku band downlink frequency spectrums from Eutelsat W3A satellite.
Orbit: 7 deg east. Recorded: 15 Sept 2005. Receive location: Chelmsford, Essex, UK
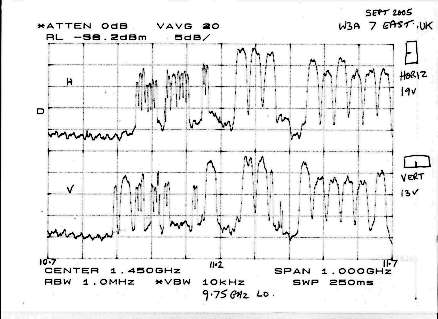
The spectrum plot below shows Ku band frequency spectrum from 10.7 to 11.7 GHz. LNB LO=9.75 GHz
The top satellite spectrum trace is horizontal polarisation, lower trace is vertical polarisation.
Observe if pin in LNB waveguide is horizontal or vertical.
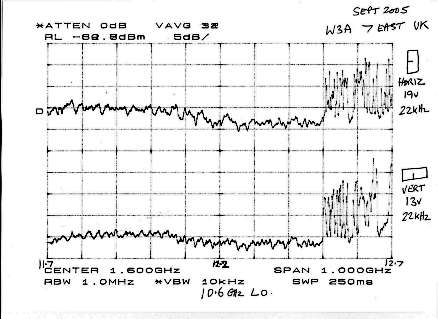
The spectrum plot below shows Ku band from 11.7 to 12.7 GHz. LNB LO=10.6 GHz
Top satellite spectrum trace is horizontal polarisation, lower trace is vertical polarisation.
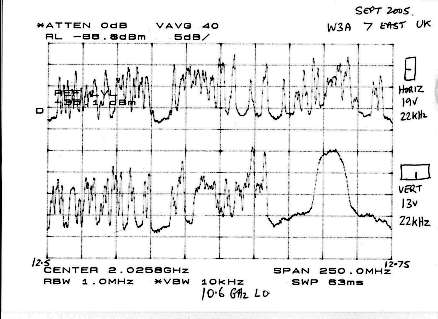
The satellite spectrum plot below shows Ku band frequency spectrum from 12.5 to 12.75 GHz on enlarged horizontal scale 250 MHz wide span. LNB LO=10.6 GHz
Top spectrum trace is horizontal polarisation, lower trace is vertical polarisation.
|
► Page created 15 Sept 2005, amended 21 June 2021. All pages on this satsig.net web site are Copyright Satellite Signals Limited © 2005 all rights reserved. |