Post by Eric Johnston on Oct 19th, 2010 at 7:31pm
You need a spectrum analyser to see and plot out your spectrum utilisation.
If the hub and remotes are in different beam coverages (cross-strapped) you will need to make spectrum plots using two earth stations, one in each coverage areas.
The iDirect NMS may be able to generate a pictorial representation of the used spectrum. I don't know how to do that.
The real spectrum plots will show interference as well as the wanted signals. The pictorial representation will help identify which carrier is which, if this is not obvious.
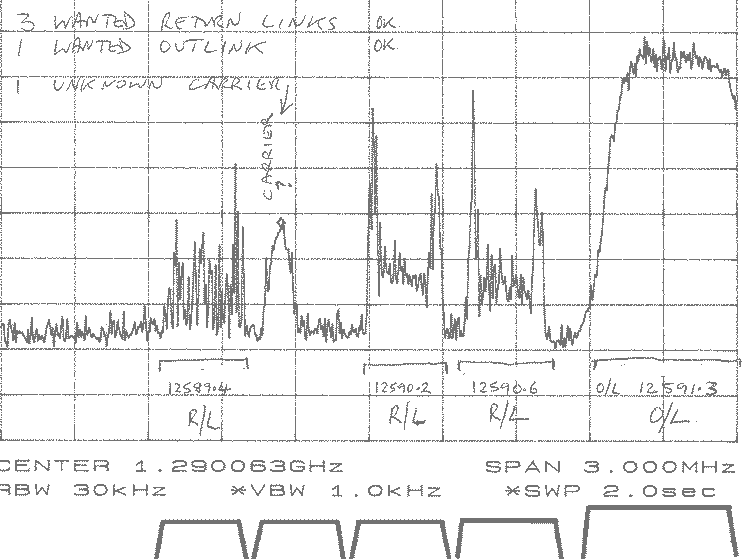
This example image above shows a VSAT system with one large outlink carrier, on the right, and four return link carrier slots, three of which (1, 3 and 4) are active at this time.
The second return link slot is temporarily inactive (sites moved to other return link slots) while a steady interfering carrier is being investigated.
The large outlink carrier is continuous and appears as expected. If you turned it off, briefly, you could see if there was any steady interference underneath.
Use of the return link TDMA carriers only shows up as fragmentary multiple spikes, each spike due to a burst from some active remote site on that return link carrier frequency. If you leave the analyser on MAX HOLD for 10 minutes all the spikes will amalgamate so that the envelope of the higher power remotes becomes clear. The spectrums of links 3 and 4 are starting to show the normal carrier shape. The high spectral density 'horns' visible at either side of the return links 3 and 4 are due to the carrier/bit timing recovery sequences at the start of all bursts, which is are not scrambled.
Note the gaps between the carriers. Watch these gaps. If they ever fill up investigate why. iDirect networks may use narrower gaps as a result of special modulation filtering to minimise such gaps.
In this example, the hub and remotes are in the same beam coverage, so the hub and the remotes can all see all of the carriers in the system. The above spectrum was recorded at a small remote so the bursts from other remotes are very low level.
If the network traffic is negligible you will not see anything of the return links so be patient (wait an hour in max hold) or crank up the traffic from one remote on each frequency to fill up the time. A spike will appear only if a remote is bursting at the instant when the analyser resolution bandwidth sweeps across a the relevent carrier frequency. More modern, FFT analysers are better, if you can afford them !
I have added a diagrammatic spectrum picture at the bottom. This might be displayable on the iDirect NMS ?
Best regards, Eric.
