www.satsig.net

Satsig.net home page

Index page for all SatSig topics

SatSig Topics IndexGeneral and other topics › Frequency Plan software
SatSig topic:

Frequency Plan software

(Read 6396 times)
Aug 14th, 2011 at 7:18am  
it would be very useful a software to draw the carriers using the center frequency and the bandwidth, in order to show the free space in a transponder. Is there a free software online? It is possible to create it (php, perl, ...) using some modules (rrdtool is a very good module but can't do this kind of graphics)?

Goodbye
Marco
Aug 15th, 2011 at 12:42pm  
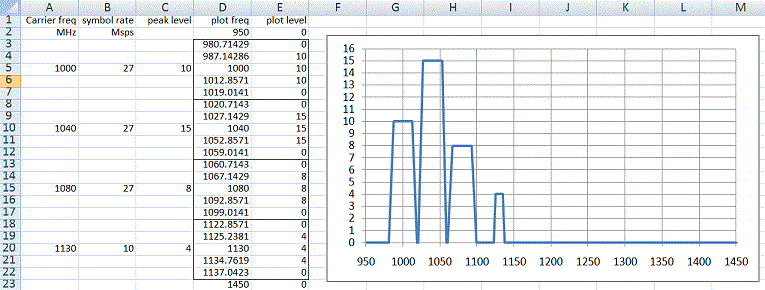
Try using Microsoft Excel.  Just input the centre frequencies and bandwidths (symbol rates) and create a column of plot frequencies to form the X axis of a chart.  You can set carrier levels for the Y axis.

Here is an example I made up in 10 minutes:
...
Here is the Excel spreadsheet: https://www.satsig.net/spectrums/frequency-plan.xls

If you want more carriers just copy and paste the 2 x 5 box with the black border outline (which contains the calculation cells), further down the spreadsheet and input your extra carrier parameters on every 5th line.

Make further amendments as you wish to personalise your chart. FM carriers might be displayed as triangles for example. Then print out the chart or whatever.

Best regards, Eric.
Aug 15th, 2011 at 1:59pm  
Eric,
thank you very much for the file. This solution is very simple but very usefull. I didn't knew this kind of function.

I was studyng a solution using perl and geometric shapes (parabolas or gaussian) in order to use a mysql db to save all the carrier properties.

...


Best Regards,
Marco

www.satsig.net

Email me:eric@satsig.net

Disclaimer, Terms of Use and Privacy

Old Forum rules

Cookie policy.